


Bitcoin surpassed $19,000 after bottoming out at $17,600 as traders anticipate a broader BTC rally.
The price of Bitcoin (BTC) has started to rally once again on Dec. 13, rising above $19,200 after dropping to sub-$17,600 on Friday. The significant increase in buyer demand in that area indicates that BTC may have just seen a short-term bottom.
When Bitcoin initially dropped to around $17,700, on-chain analysts, including Edward Morra and Nik Yaremchuk, pinpointed large buy orders on Bitfinex and Coinbase.
As soon as the BTC price briefly dropped below $17,700, it started to rebound quickly, reclaiming $18,000 within three hours.
Is this the new Bitcoin run-up to the all-time high?
Conventional technical analysis suggested that the logical Bitcoin bottom would likely be established at $17,000. It marked the top of a weekly candle in January 2018, and it is also a major support area on lower time frame charts.
Morra noted that Bitcoin may have appeared to recover randomly at $17,600 if traders were not observing exchange heatmaps.

Order books and heatmaps showed whales heavily bidding the $17,600 level, which likely marked a local bottom. Morra said:
“Finex whale protecc, Note that regular charts looked pretty ugly and price bounced out of nowhere to you if you didn’t watch heatmaps.”
Yaremchuk, a cryptocurrency trader and an on-chain analyst, shared a similar sentiment when Bitcoin hit $17,600. On Dec. 11, the trader said:
“$BTC reached $17.6k in my opinion, this is the bottom.”
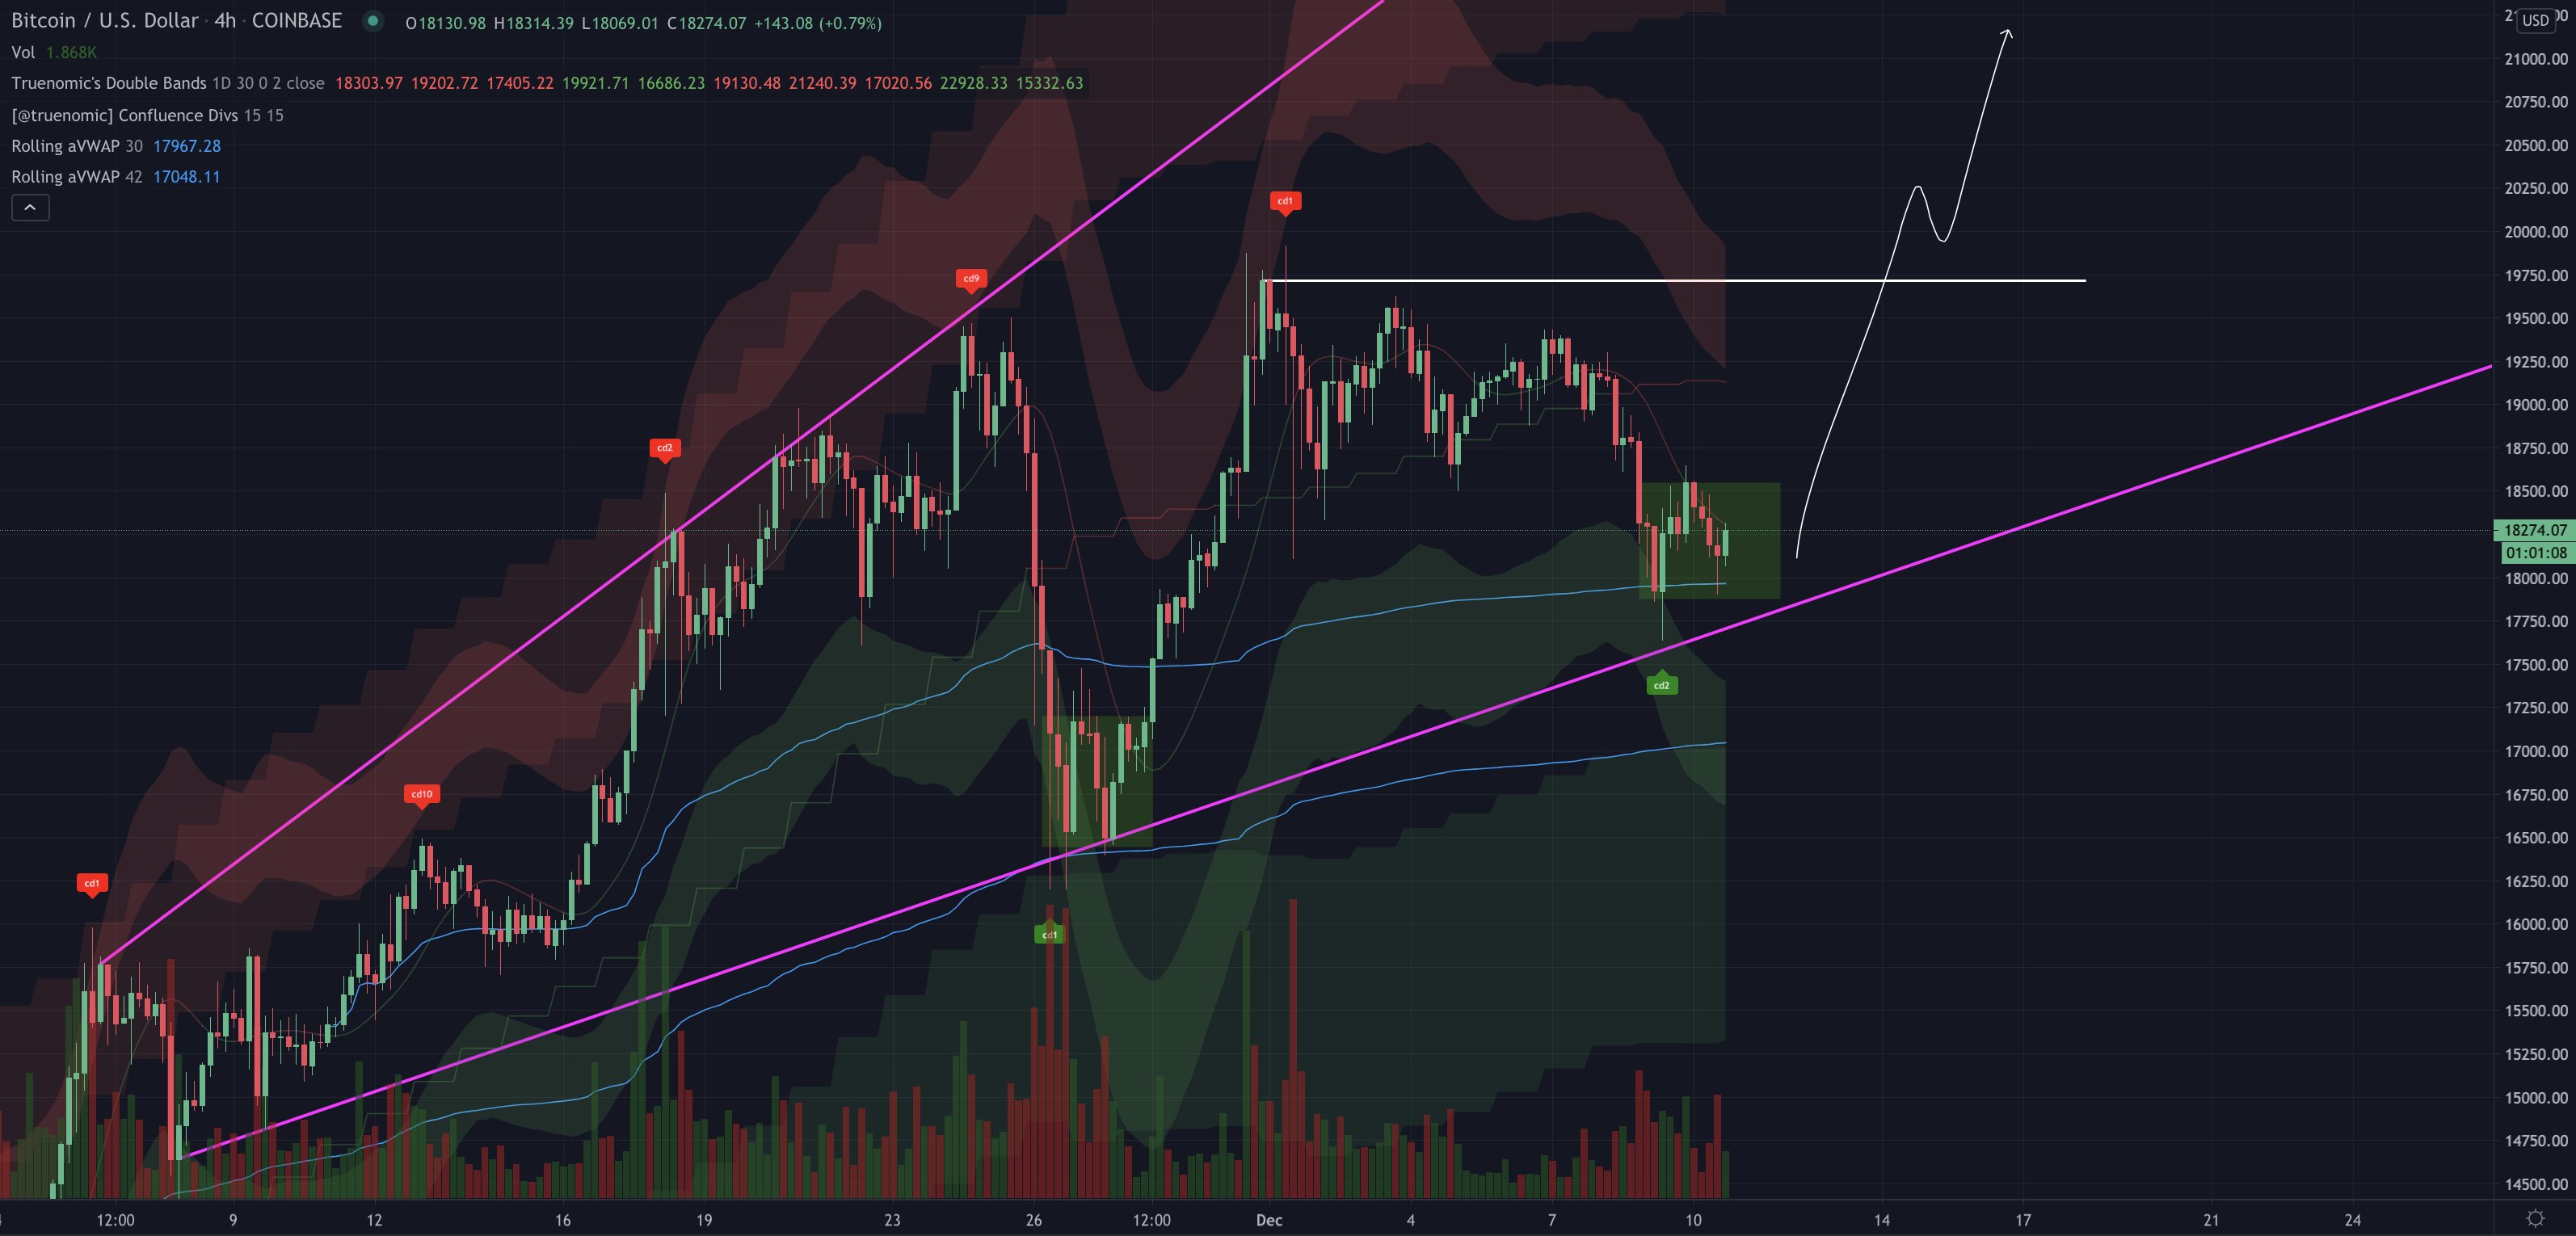
Bitcoin rebounding from $17,600 is highly optimistic because it printed a higher low formation on the 4-hour chart. This means that the bottom of the recent correction is higher than the previous bottom — a trend often spotted during rallies.
The Bitcoin price also began to rally after it surpassed $18,800, which Cointelegraph identified as a potential whale cluster area and key resistance level.
Next levels to watch
In the near term, there are two key factors to consider. First, as Cointelegraph consistently reported, Bitcoin sell-pressure remains relatively high. Second, this would mark the second retest of the all-time high since Nov. 30.
There is an argument to be made that there is now less selling pressure in the near term since miners and whales sold-off heavily last week. In other words, this was the much-anticipated correction and the bullish U-turn has been confirmed.
The probability of new all-time highs increases further if Bitcoin surpasses the $19,400 resistance next with low selling pressure.
A pseudonymous trader known as “Beastlorion” said that the lack of sell pressure may trigger a big rally in the short term, saying:
“The price action on $BTC right now is something else. There’s like 0 sell pressure. It feels like the price is getting pulled up at this point instead of pushing up. Just look at those volume bars. Big pump coming IMO.”
[…]
Learn more
Leave a Reply